Planogram Analytics:

What it is, why you need it, and how to use it
It is known from the principles of merchandising that the best sellers are those goods that are at eye level, i.e. at a height of 100-170 cm. So let's take this point into account when forming the display and place on these "golden" shelves that product that brings the most profit. Or you need to promote the novelty, it should also be placed on these shelves. Or vice versa, there is a nomenclature that sells well, and we know that it will be bought anyway - let's put it on a lower shelf, and give the convenient shelves for goods with good margins, but unimportant in terms of sales in pieces. It is clear that all this can be done manually or left to the line staff in the store. But what do you do if there are really a lot of products? 10,000, 20,000, 30,000 SKU? How to take into account a set of different display criteria for different groups of nomenclature? Somewhere turnover in pieces is more important, somewhere margin is more important, somewhere you need to arrange the goods by height, alphabetically, by age group of buyers and so on and so forth. The point is that the place of goods on the shelf affects the behavior of customers, and you need to take advantage of this.
Increasing sales
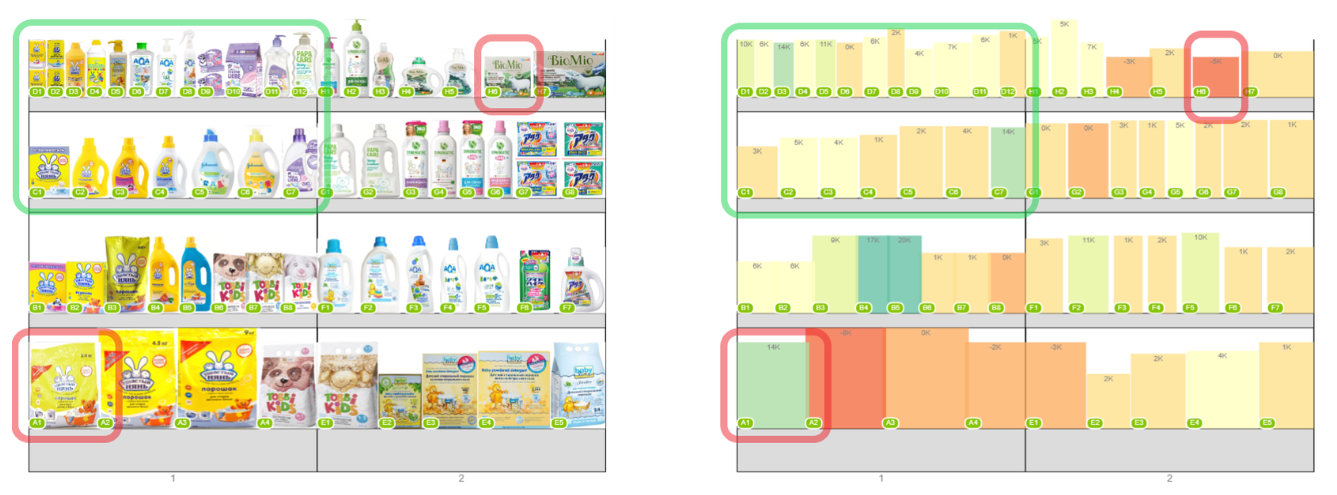
Estimation of optimal lay-out according to the "Profit" criterion

Example of a heat map of a profit planogram. The color of the rectangle encodes the margin from red (low margin) to green (high margin). Products with wrong position on the shelf are highlighted with red stroke, products with correct position on the shelf are highlighted with green stroke.
The point is that very often, under the terms and conditions stipulated in a marketing agreement, a chain undertakes to keep a certain list of goods (SKU) in the hall in accordance with the specified shelf space and quantity. Let's assume that at least 40-50 suppliers supply goods to the chain. This is not much. But it becomes difficult to control the compliance of planograms with all marketing conditions even for such a number of suppliers. Let's say one supplier out of 50 introduced a new item into his assortment (or removed an old one): you may simply not be able to track this moment. Today no one will notice it, tomorrow no one will notice it. And the day after tomorrow (suddenly) the retro-bonus of the network will be reduced because of a breach of marketing conditions.
Marketing agreements and rotation of assortment matrices
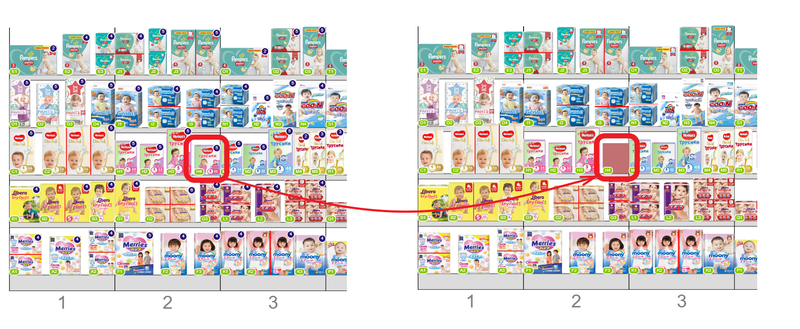
Estimation of optimal lay-out according to the "Profit" criterion
An item that has been withdrawn by the supplier from its assortment is highlighted in red.
